Nasty Sales Graphs

4/14/2010
 Nasty
Nasty, XBLIG

(0)
As of late, all the cool XNA developers are sharing their sales data and making fancy graphs for said data. While some are using Google Doc, I've instead choose (i.e. I'm too lazy to learn something new) to stick with tried and true Microsoft Excel.
Nasty was released on August 24th, 2009 at a price of 400 Microsoft Points. On December 5th, 2009, the price of Nasty was dropped to 80 Microsoft Points. The price drop is important to remember when looking at these graphs as you'll see very sudden changes starting in December.
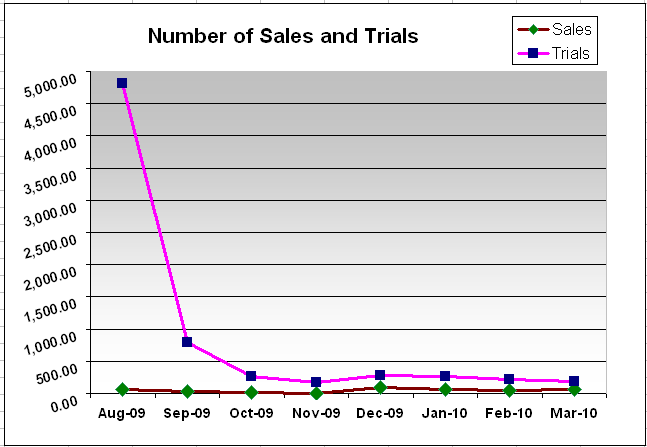
In this first graph, you see a list of all sales and trials. Note, as is typical with XBLIGs that don't maintain a position on one of the Top Downloads / Top Rated lists, the initial period is very high in Trials and subsequent purchases and it tails off very quickly from there. Unfortunately this very high first month makes it hard to see the variations in data in subsequent months.
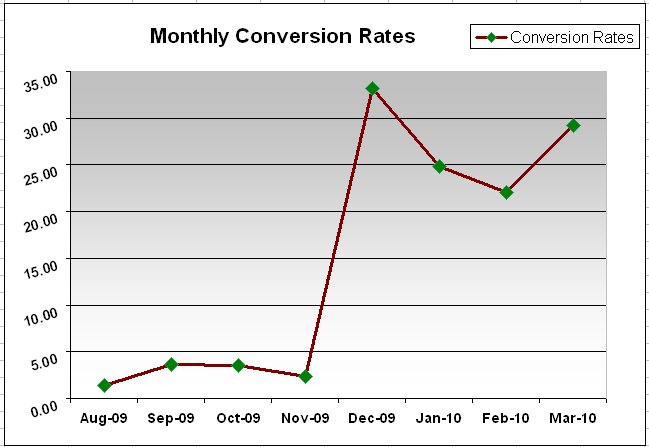
This next graph shows the Conversion Rates for Nasty (number of sales per download). Again as is typical of XBLIGs, the first month has a low conversion rate (much broader market with presumably many people that demo but don't buy many XBLIGs). The rate increases slightly in the following months and then explodes upward when the price is dropped to 80 Microsoft Points.
In order for the price drop to be a success, Nasty's conversion rate would have had to rise to nearly 12%. The average conversion rate since the change has been over 27%. While I didn't include April numbers in the graphs, Nasty is currently on pace to have its highest conversion rate yet, sitting at 35% as of today. I'm very pleased with the conversion rate since the price change, which is one of the higher rates I've seen for XBLIGs, but because trials downloads are still low, this high rate hasn't helped game sales as much as I would have liked.
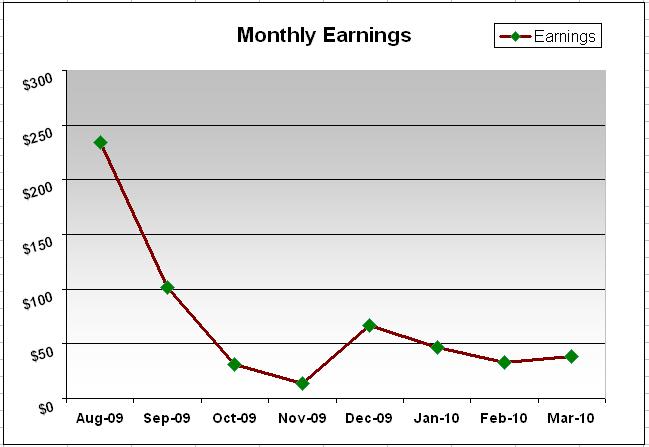
This graph shows how much money I pocketed from Nasty's release (though in reality I still haven't made a profit, having made back about a third of development costs at this point). The initial month and the following month, where Nasty was still positioned in the Top Downloads and New Releases list, you can see my earnings were far higher than anytime since. The monthly earnings bottom out in November (just $14) but raise a fair amount after the price change to average $46 a month. While not enough to live off of, it is enough that Nasty could realistically return a profit some day.
Nasty sales have been an interesting ride. Initially high, then low, then higher than low. I am pretty disappointed how profitable the game has been, but I feel the ups and downs have been a good learning experience and I'm hopeful future games will yield more positive results.


This article has been view 769 times.
|